Update legend text
Note: Support for 3D on mobile devices may vary, view the system requirements for more information.
This sample shows how to alter the text of a Legend through the renderer's properties and authoring info. Whether you're creating a UniqueValueRenderer, a ClassBreaksRenderer, or a SimpleRenderer with visual variables, the text shown in the legend is always handled in the renderer.
The layer in this sample is rendered with a relationship renderer, also known as a bivariate choropleth visualization, which classifies two numeric variables in either 2, 3, or 4 classes along separate color ramps. One of those ramps is rotated 90 degrees and overlaid on the other to create a 2x2, 3x3, or 4x4 square grid. The x-axis indicates the range of values for one variable, and the y-axis indicates the range for the second variable. The squares running diagonal from the lower left corner to the upper right corner indicate features where the two variables may be related or in agreement with one another.
The lower right and upper left corners indicate features where one field has high values and the other field low values and vice versa.
Keep in mind that even if you observe a positive relationship between the two variables of interest, it doesn't mean they are statistically correlated. It also doesn't imply the presence of one variable influences the other. Therefore, this renderer should be used judiciously with some prior knowledge that two variables may likely be related.
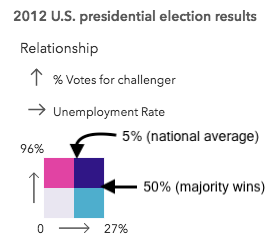
This particular visualization uses a 2x2 grid to show the potential relationship between the percentage of voters who voted for the challenger and the unemployment rate. The breakpoint between both classes in each variable is described in the image below.

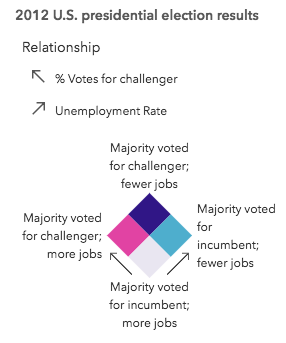
While the numbers are useful, and provide context, it may be more desireable to describe each corner of the legend with simple text since some of the map readers may not know what range is considered high or low for a particular variable. Therefore providing the option to switch labels on the legend may be useful depending on the audience.

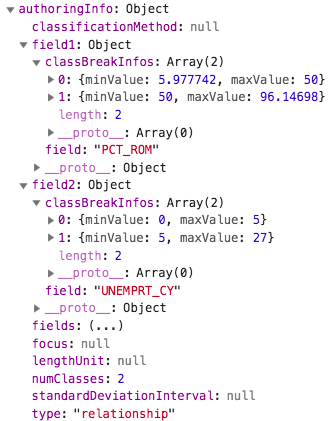
Technically, the relationship renderer is a UniqueValueRenderer instance driven by values returned from an Arcade expression. Therefore, you can alter the legend text by changing the label property in each uniqueValueInfo object. We'll use the min and max values for each class to label the axes of the legend when the option to display numbers is selected by the user. The authoringInfo property of the layer provides us with that information.

The function in the snippet below uses the information in the authoringInfo to display the range of each variable instead of descriptive text. If descriptive text is desired, then the text is swapped in favor of the numbers.
function changeRendererLabels(renderer, showDescriptiveLabels){

  const numClasses = renderer.authoringInfo.numClasses;
  const field1max = renderer.authoringInfo.field1.classBreakInfos[ numClasses-1 ].maxValue;
  const field2max = renderer.authoringInfo.field2.classBreakInfos[ numClasses-1 ].maxValue;

  renderer.uniqueValueInfos.forEach(function(info){
    switch (info.value) {
      case "HH":
        info.label = showDescriptiveLabels ? "Majority voted for challenger; fewer jobs" : "";
        break;
      case "HL":
        info.label = showDescriptiveLabels ? "Majority voted for challenger; more jobs" : Math.round(field1max) + "%";
        break;
      case "LH":
        info.label = showDescriptiveLabels ? "Majority voted for incumbent; fewer jobs" : Math.round(field2max) + "%";
        break;
      case "LL":
        info.label = showDescriptiveLabels ? "Majority voted for incumbent; more jobs" : 0;
        break;
    }
  });

  // When a focus is specified, the legend renders as a diamond with the
  // indicated focus value on the top. If no value is specified, then
  // the legend renders as a square

  renderer.authoringInfo.focus = showDescriptiveLabels ? "HH" : null;

  return renderer;
}
Also notice you can change the rotation of the legend by modifying the value of the focus property of the authoringInfo in the layer.