Renderer
esri/renderers/RendererRenderers define how to visually represent each feature in one of the following layer types:
The Renderer object contains drawing information for the layer and is the base class for all renderers.
There are three types of renderers available for visualizing data. Each serves a different purpose, allowing you to explore your data and tell a visual story about it by combining geography and statistics. Most cartographic visualizations fall into one of the following categories.
| Visualization type | Renderer |
|---|---|
| Location only | SimpleRenderer |
| Unique (typed) values | UniqueValueRenderer |
| Class breaks | ClassBreaksRenderer |
| Continuous color/size | SimpleRenderer or UniqueValueRenderer with visualVariables |
| Multivariate | SimpleRenderer or UniqueValueRenderer with visualVariables |
Location
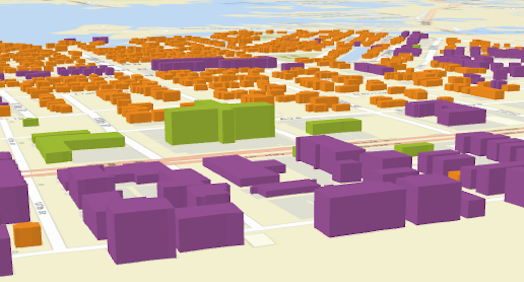
In many cases, the user just wants to see where a set of features are located. Some examples might be political boundaries, cities, buildings, rivers, etc. These are scenarios where you want all features in the layer to have the same symbol. To accomplish this you would use a SimpleRenderer.
The example in the screenshot below contains three layers; each uses a SimpleRenderer to assign all features the same symbol. The polygon layer represents states with a simple green fill and gray outline. The polyline layer visualizes highways with bright green lines. The point layer depicts cities as orange points.
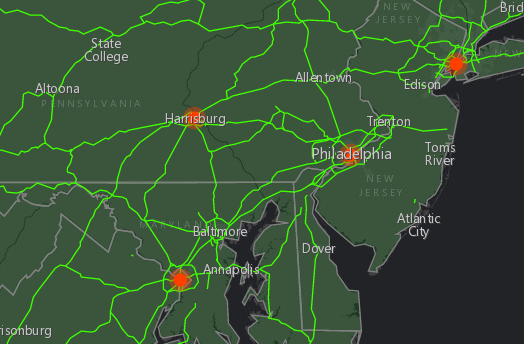
Read more on the SimpleRenderer page.
Unique types
UniqueValueRenderer allows you to symbolize features based on one or more matching string attribute values. Unique values are typically visualized with colors, fill styles, or images to represent features of similar types.
In the image below, each line is symbolized with a different color depending on the jurisdiction to which the highway belongs. For example, green lines are highways in the "Tampa District" whereas red lines are highways in the "Central District".
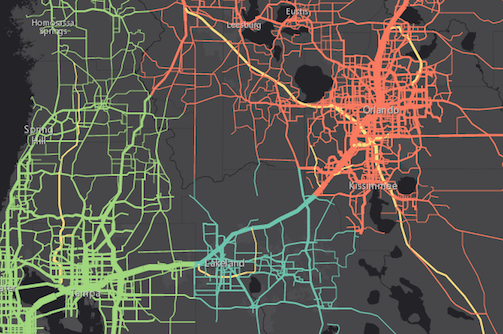
Read more on the UniqueValueRenderer page.
Class breaks
ClassBreaksRenderer sets the symbol of each feature in a layer based on the value of a numeric attribute. Symbols are assigned to classes, or ranges of data. Each feature is assigned a symbol based on the class in which the value of the attribute falls. In the example below a FeatureLayer representing block groups is rendered with a ClassBreaksRenderer. Features where fewer than 35% of the population have a college degree are rendered with a deep green color. Features where between 35% and 50% of the population have a college degree are rendered with a pale green symbol. The other features are similarly rendered based on the value of the attribute of interest.
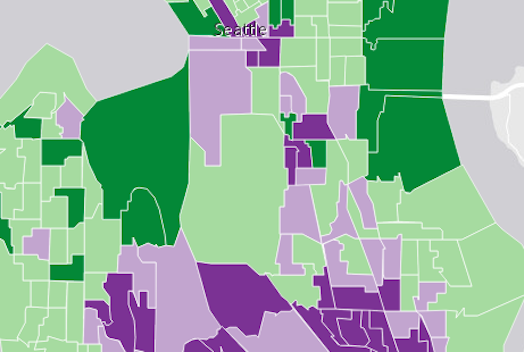
Read more on the ClassBreaksRenderer page.
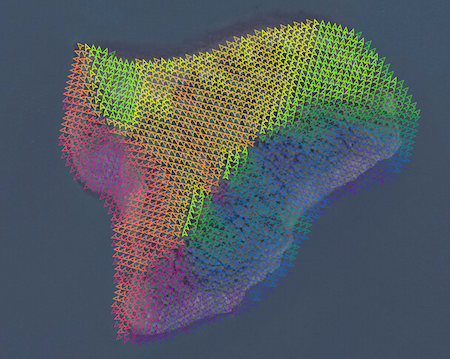
Continuous ramps and multivariate visualizations
Rather than manually creating several class breaks to visualize numeric data, you can create simple yet stunning visualizations using continuous color, size, opacity or any combination of those techniques using visualVariables in a SimpleRenderer.
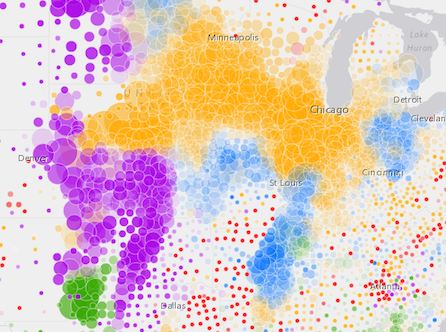
The example below uses a UniqueValueRenderer with an opacity visual variable to map predominant types and the strength of their predominance in relation to other variables.
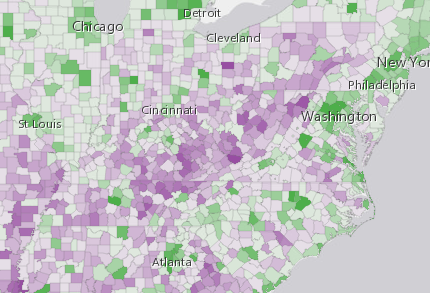
See visual variables for more information.
Property Overview
| Name | Type | Summary | Class | |
|---|---|---|---|---|
| AuthoringInfo | Authoring metadata only included in renderers generated from one of the Smart Mapping creator methods, such as sizeRendererCreator.createContinuousRenderer() or colorRendererCreator.createContinuousRenderer(). more details | more details | Renderer | |
| String | The name of the class. more details | more details | Accessor | |
| String | The renderer type. more details | more details | Renderer |
Property Details
- authoringInfoautocast
Authoring metadata only included in renderers generated from one of the Smart Mapping creator methods, such as sizeRendererCreator.createContinuousRenderer() or colorRendererCreator.createContinuousRenderer(). This includes information from UI elements such as sliders and selected classification methods and themes. This allows the authoring clients to save specific overridable settings so that next time it is accessed via the UI, their selections can be remembered.
- Since: ArcGIS API for JavaScript 4.7
The name of the class. The declared class name is formatted as
esri.folder.className.
- typeStringreadonly
The renderer type.
Possible values: class-breaks | heatmap | simple | unique-value
Method Overview
| Name | Return Type | Summary | Class | |
|---|---|---|---|---|
| * | Creates a new instance of this class and initializes it with values from a JSON object generated from a product in the ArcGIS platform. more details | more details | Renderer | |
| Object | Converts an instance of this class to its ArcGIS portal JSON representation. more details | more details | Renderer |
Method Details
- fromJSON(json){*}static
Creates a new instance of this class and initializes it with values from a JSON object generated from a product in the ArcGIS platform. The object passed into the input
jsonparameter often comes from a response to a query operation in the REST API or a toJSON() method from another ArcGIS product. See the Using fromJSON() topic in the Guide for details and examples of when and how to use this function.Parameter:json ObjectA JSON representation of the instance in the ArcGIS format. See the ArcGIS REST API documentation for examples of the structure of various input JSON objects.
Returns:Type Description * Returns a new instance of this class.
- toJSON(){Object}
Converts an instance of this class to its ArcGIS portal JSON representation. See the Using fromJSON() topic in the Guide for more information.
Returns:Type Description Object The ArcGIS portal JSON representation of an instance of this class.
Type Definitions
- BoundedMinMax
Defines a size visual variable with minimum and maximum bounds. When an object with this specification is applied to the visualVariables property of a renderer, then feature sizes are bounded by min and max data values. Features with values greater than the provided max value are assigned the specified maximum size. Likewise, features with values less than the provied min value are assigned the specified minimum size. Features with values between the min and the max are assigned a corresponding size that is linearly interpolated between the provided min and max size values.
The object specification for this object is provided below.
- Properties:
- type String
Value must be
size.optionalfield StringThe name of the numeric attribute field that contains the data values used to determine the size of each feature.
optionalnormalizationField StringThe name of the numeric attribute field used to normalize the data in
field. If this field is used, then the values inmaxDataValueandminDataValueshould be normalized as percentages or ratios.optionalvalueExpression StringAn Arcade expression evaluating to a number. This expression can reference field values using the
$featureglobal variable and perform mathematical calculations and logical evaluations at runtime. The values returned from this expression are the data used to drive the visualization. This takes precedence overfield. Therefore, this property is typically used as an alternative tofieldin visual variables.optionalvalueExpressionTitle StringThe title identifying and describing the associated Arcade expression as defined in the
valueExpressionproperty. This is displayed as the title of the corresponding size ramp in the Legend in the absence of a providedtitlein thelegendOptionsproperty.maxDataValue NumberThe maximum data value used in the size ramp. Features with this value or higher will be rendered at the size defined in
maxSize.The size used to render a feature containing the maximum data value.
- When setting a number, sizes are expressed in points for all 2D symbols and 3D flat symbol layers; size is expressed in meters for all 3D volumetric symbols.
- String values are only supported for 2D symbols and 3D flat symbol layers. Strings may specify size in either points or pixels (e.g.
minSize: "16pt",minSize: "12px").
minDataValue NumberThe minimum data value used in the size ramp. Features with this value or lower will be rendered at the size defined in
minSize.The size used to render a feature containing the minimum data value.
- When setting a number, sizes are expressed in points for all 2D symbols and 3D flat symbol layers; size is expressed in meters for all 3D volumetric symbols.
- String values are only supported for 2D symbols and 3D flat symbol layers. Strings may specify size in either points or pixels (e.g.
minSize: "16pt",minSize: "12px").
optionallegendOptions ObjectAn object providing options for displaying the size ramp in the Legend.
optionalaxis StringDefault Value:allOnly applicable when working in a SceneView. Defines the axis the size visual variable should be applied to when rendering features with an ObjectSymbol3DLayer. See the local scene sample for an example of this.
Possible Value Description width The diameter of the symbol from east to west. depth The diameter of the symbol from north to south. height The height of the symbol. width-and-depth Applies the size visual variable to both width and depth axes. all Applies the size visual variable to all axes. optionaluseSymbolValue BooleanWhen setting a size visual variable on a renderer using an ObjectSymbol3DLayer, this property indicates whether to apply the value defined by the height, width, or depth properties to the corresponding axis of this visual variable instead of proportionally scaling this axis' value after other axes. View an example of this.
Examples:// thematic size defined with min and max data values var sizeVisVar = { type: "size", field: "POPULATION", // features with this value or lower will be assigned the size defined in minSize minDataValue: 5000, // features with this value or higher will be assigned the size defined in maxSize maxDataValue: 1000000, minSize: "6px", maxSize: "80px" }; renderer.visualVariables.push(sizeVisVar);// 3D thematic extrusion var sizeVisVar = { type: "size", field: "POP_POVERTY", normalizationField: "TOTPOP_CY", minDataValue: 0.10, // 10% of population in poverty maxDataValue: 0.35, // 35% of population in poverty minSize: 10000, // extruded by 10,0000 meters maxSize: 500000 // extruded by 500,000 meters }; renderer.visualVariables.push(sizeVisVar);
- ColorVisualVariable
The color visual variable defines how a continuous color ramp is applied to features based on the values of a numeric attribute field. The minimum and maximum values of the data should be indicated along with their respective color values. You must specify
stopsto construct the color ramp, and eitherfieldorvalueExpressionto define the driving value.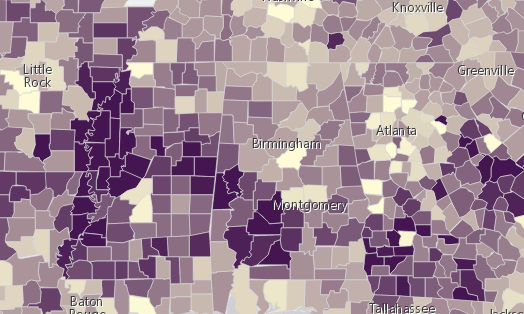
The object specification for color is provided below.
- Properties:
- type String
Required. Value must be
color.optionalfield StringThe name of the numeric attribute field that contains the data values used to determine the color of each feature.
optionalnormalizationField StringName of the numeric attribute field by which to normalize the data. If this field is used, then the values in
stopsshould be normalized as percentages or ratios.optionalvalueExpression StringAn Arcade expression evaluating to a number. This expression can reference field values using the
$featureglobal variable and perform mathematical calculations and logical evaluations at runtime. The values returned from this expression are the data used to drive the visualization. This takes precedence overfield. Therefore, this property is typically used as an alternative tofieldin visual variables.optionalvalueExpressionTitle StringThe title identifying and describing the associated Arcade expression as defined in the
valueExpressionproperty. This is displayed as the title of the corresponding color ramp in the Legend in the absence of a providedtitlein thelegendOptionsproperty.optionallegendOptions ObjectAn object providing options for displaying the color ramp in the Legend.
stops Object[]An array of objects that defines the color ramp in a sequence of stops. At least two stops are required. Features with values between the given stops will be assigned colors along the ramp proportional to the minimum and maximum values used. The stops must be listed in ascending order based on the value of the
valueproperty in each stop. Each stop object has the following specification: - See also:
Examples:// color visual variable using stops var colorVisVar = { type: "color", field: "POPULATION", normalizationField: "SQ_KM", stops: [{ value: 30, color: "#FFFCD4" }, { value: 6000, color: "#0D2644" }] }; renderer.visualVariables.push(colorVisVar);// color visual variable with arcade var colorVisVar = { type: "color", valueExpression: "( $feature.TOT_VOTES / $feature.REG_VOTERS ) * 100", stops: [{ value: 30, color: "#FFFCD4" }, { value: 70, color: "#0D2644" }] }; renderer.visualVariables.push(colorVisVar);
- OpacityVisualVariable
The opacity visual variable defines the opacity of each feature's symbol based on a numeric attribute field value. The minimum and maximum values of the data should be indicated along with their respective opacity values. The specification for this object is provided below. You must specify
stopsto construct the opacity ramp, and eitherfieldorvalueExpressionto define the driving value.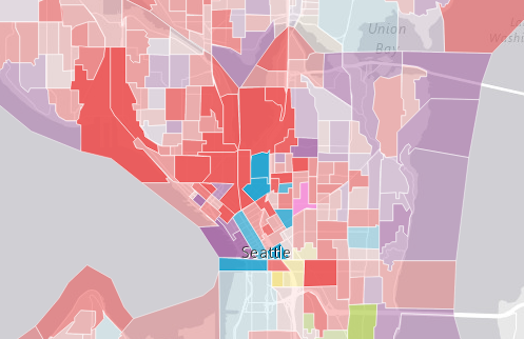
- Properties:
- type String
Required. Value must be
opacity.optionalfield StringThe name of the numeric attribute field that contains the data values used to determine the opacity of each feature.
optionalnormalizationField StringName of the attribute field by which to normalize the data. If this field is used, then the values in
stopsshould be normalized as percentages or ratios.optionalvalueExpression StringAn Arcade expression evaluating to a number. This expression can reference field values using the
$featureglobal variable and perform mathematical calculations and logical evaluations at runtime. The values returned from this expression are the data used to drive the visualization. This takes precedence overfield. Therefore, this property is typically used as an alternative tofieldin visual variables.optionalvalueExpressionTitle StringThe title identifying and describing the associated Arcade expression as defined in the
valueExpressionproperty. This is displayed as the title of the corresponding opacity ramp in the Legend in the absence of a providedtitlein thelegendOptionsproperty.optionallegendOptions ObjectAn object providing options for displaying the opacity ramp in the Legend.
stops Object[]An array of objects that defines the thematic opacity ramp in a sequence of stops. At least two stops are required. The stops must be listed in ascending order based on the value of the
valueproperty in each stop. Each stop object has the following specification: - See also:
Examples:// opacity with stops defined var opacVisVar = { // The type must be opacity type: "opacity", // Assign the field name to visualize with opacity field: "PERCENTAGE", // maps data values to opacity values stops: [{ value: 0, opacity: 0.1 }, { value: 100, opacity: 1 }] } renderer.visualVariables.push(opacVisVar);// opacity visual variable with arcade var opacityVisVar = { // The type must be set to opacity type: "opacity", // calculate a value to visualize with opacity valueExpression: "( $feature.TOT_VOTES / $feature.REG_VOTERS ) * 100", // Set color ramp using stops stops: [{ value: 30, opacity: 0.15 }, { value: 70, opacity: 0.15 }] }; renderer.visualVariables.push(opacityVisVar);
- RealWorldSize
Defines a size visual variable where data values are interpreted as real-world sizes based on a given unit. Features are then sized according to the real-world measurements, not thematic values and screen units.
The object specification for this object is provided below.
- Properties:
- type String
Value must be
size.optionalfield StringThe name of the numeric attribute field that contains the data values used to determine the size of each feature.
optionalvalueExpression StringAn Arcade expression evaluating to a number. This expression can reference field values using the
$featureglobal variable and perform mathematical calculations and logical evaluations at runtime. The values returned from this expression are the data used to drive the visualization. This takes precedence overfield. Therefore, this property is typically used as an alternative tofieldin visual variables.optionalvalueExpressionTitle StringThe title identifying and describing the associated Arcade expression as defined in the
valueExpressionproperty. This is displayed as the title of the corresponding size ramp in the Legend in the absence of a providedtitlein thelegendOptionsproperty.valueUnit StringIndicates the unit of measurement used to interpret the value returned by
fieldorvalueExpression. For 3D volumetric symbols the default ismeters. This property should not be used if the data value represents a thematic quantity (e.g. traffic count, census data, etc.).Possible Values: unknown | inches | feet | yards | miles | nautical-miles | millimeters | centimeters | decimeters | meters | kilometers | decimal-degrees
optionalvalueRepresentation StringSpecifies how to apply the data value when mapping real-world sizes. See table below for supported values.
Value Description radius The point data value represents the radius of a circular feature. diameter The point data value represents the diameter of a circular feature. area The point data value represents the area of a feature. width The polyline data value represents the width of a line. distance The polyline data value represents the distance from the center line (one half of the width). optionallegendOptions ObjectAn object providing options for displaying the size ramp in the Legend.
optionalaxis StringDefault Value:allOnly applicable when working in a SceneView. Defines the axis the size visual variable should be applied to when rendering features with an ObjectSymbol3DLayer. See the local scene sample for an example of this.
Possible Value Description width The diameter of the symbol from east to west. depth The diameter of the symbol from north to south. height The height of the symbol. width-and-depth Applies the size visual variable to both width and depth axes. all Applies the size visual variable to all axes. optionaluseSymbolValue BooleanWhen setting a size visual variable on a renderer using an ObjectSymbol3DLayer, this property indicates whether to apply the value defined by the height, width, or depth properties to the corresponding axis of this visual variable instead of proportionally scaling this axis' value after other axes. View an example of this.
- See also:
Examples:// real-world size for 3D buildings var sizeVisVar = { // The type must be set to size type: "size", // Assign the field name to visualize with size field: "HEIGHT", valueUnit: "feet" }; renderer.visualVariables.push(sizeVisVar);// real-world size for 2D tree canopies var sizeVisVar = { // The type must be set to size type: "size", // Assign the field name to visualize with size field: "CANOPY", valueUnit: "feet", valueRepresentation: "diameter" }; renderer.visualVariables.push(sizeVisVar);
- RotationVisualVariable
The rotation visual variable defines how features rendered with marker symbols or text symbols in a MapView or 3D object symbol layers in a SceneView are rotated. The rotation value is determined by mapping the values to data in a field, or by other arithmetic means with an Arcade expression.
This object may be used to depict variables such as wind direction, vehicle heading, etc.
Known Limitations
In a SceneView rotation visual variables are not currently supported with marker symbols, text symbols, 3D icon symbol layers and 3D text symbol layers.
- Properties:
- type String
Required. Value must be
rotation.optionalfield StringThe name of the numeric attribute field that contains the rotation angle of each feature.
optionalvalueExpression StringAn Arcade expression evaluating to a number. This expression can reference field values using the
$featureglobal variable and perform mathematical calculations and logical evaluations at runtime. The values returned from this expression are the data used to drive the visualization. This takes precedence overfield. Therefore, this property is typically used as an alternative tofieldin visual variables.optionalaxis StringDefault Value:headingOnly applicable when working in a SceneView. Defines the axis the rotation visual variable should be applied to when rendering features with an ObjectSymbol3DLayer.
If the symbol resource is aligned such that its forward facing side points in the direction of the y-axis (the y-axis always points North in WGS84 or WebMercator coordinates), its upwards facing side is pointing in the direction of the z-axis, and its right-hand side points in the direction of the x-axis (the x-axis always points East in WGS84 or WebMercator coordinates), then the following rotation axis will rotate the symbol as indicated by their name.
Possible Value Description heading The rotation of the symbol in the horizontal plane (i.e., around the z axis). tilt The rotation of the symbol in the longitudinal vertical plane (i.e., around the x axis). roll The rotation of the symbol in the lateral vertical plane (i.e., around the y axis). optionalrotationType StringDefault Value:geographicDefines the origin and direction of rotation depending on how the angle of rotation was measured. See the table below for a list of possible values. This property only applies to rotations around the
headingaxis.Value Description geographic Rotates the symbol from the north in a clockwise direction. arithmetic Rotates the symbol from the east in a counter-clockwise direction. - See also:
- ScaleDependentIcons
Only applicable to MapView.
Defines icon sizes in a size visual variable based on minimum and maximum bounds similar to the BoundedMinMax case. However, this specification allows the developer to specify various min and max sizes based on the MapView.scale.
Features with values greater than the provided max value are assigned the specified maximum size for the given view scale. Likewise, features with values less than the provied min value are assigned the specified minumum size for the given view scale. Features with values between the min and the max are assigned a corresponding size that is linearly interpolated between the provided min and max size values for the given scale value.
The object specification for this object is provided below.
- Properties:
- type String
Value must be
size.optionalfield StringThe name of the numeric attribute field that contains the data values used to determine the size of each feature.
optionalnormalizationField StringThe name of the numeric attribute field used to normalize the data in
field. If this field is used, then the values inmaxDataValueandminDataValueshould be normalized as percentages or ratios.optionalvalueExpression StringAn Arcade expression evaluating to a number. This expression can reference field values using the
$featureglobal variable and perform mathematical calculations and logical evaluations at runtime. The values returned from this expression are the data used to drive the visualization. This takes precedence overfield.optionalvalueExpressionTitle StringThe title identifying and describing the associated Arcade expression as defined in the
valueExpressionproperty. This is displayed as the title of the corresponding size ramp in the Legend in the absence of a providedtitlein thelegendOptionsproperty.maxDataValue NumberThe maximum data value used in the size ramp. Features with this value or higher will be rendered at the size defined in
maxSize.maxSize ScaleDependentStopsAn object defining the size of features whose data value (defined in
fieldorvalueExpression) is greater than or equal to themaxDataValuefor the given view scale.minDataValue NumberThe minimum data value used in the size ramp. Features with this value or lower will be rendered at the size defined in
minSize.minSize ScaleDependentStopsAn object defining the size of features whose data value (defined in
fieldorvalueExpression) is less than or equal to theminDataValuefor the given view scale.optionallegendOptions ObjectAn object providing options for displaying the size ramp in the Legend.
- See also:
Example:// scale-dependent size var sizeVisVar = { type: "size", field: "pop2000", minDataValue: 500000, maxDataValue: 33000000, // minimum size to render minDataVal at specified view scales minSize: { type: "size", valueExpression: "$view.scale", stops: [ { value: 1128, size: 12 }, // smallest marker will be 12pt at 1:1128 scale { value: 288895, size: 12 }, { value: 73957191, size: 7 }, { value: 591657528, size: 1.5 } // smallest marker will be 1.5pt at 1:591657528 scale ] }, // maximum size to render maxDataVal at specified view scales maxSize: { type: "size", valueExpression: "$view.scale", stops: [ { value: 1128, size: 60 }, // largest marker will be 60pt at 1:1128 scale { value: 288895, size: 60 }, { value: 73957191, size: 37 }, { value: 591657528, size: 19 } // largest marker will be 19pt at 1:591657528 scale ] } }; renderer.visualVariables.push(sizeVisVar);
- ScaleDependentStops
Only applicable to MapView.
Defines feature sizes and outline widths in a size visual variable based on the MapView.scale. It also provides the specification of the
minSizeandmaxSizeproperties in a ScaleDependentIcons size visual variable.The object specification for this object is provided below.
- Properties:
- type String
Value must be
size.valueExpression StringThis value must be
$view.scale.optionalexpression StringDeprecated since version 4.2. Use
valueExpressioninstead. The only supported expression isview.scale.optionaltarget StringThis value must be
outlinewhen scaling polygon outline widths based on the view scale. If scale-dependent icons are desired, then this property should be ignored.stops Object[]An array of objects that define the size of the icon (or alternatively the width of the polygon outline) at the given scale
value. At least two stops are required. The stops must be listed in ascending order based on the value of thevalueproperty in each stop. Each stop object has the following specification:- Specification:
- value Number
Specifies the scale value to map with the given
size. When the MapView.scale equals the given number then icons (or outlines) will be rendered with the given size.The size at which to render features at the specified scale
value.
- See also:
Example:// scale-dependent size var sizeVisVar = { type: "size", field: "pop2000", minDataValue: 500000, maxDataValue: 33000000, // minimum size to render minDataVal at specified view scales minSize: { type: "size", valueExpression: "$view.scale", stops: [ { value: 1128, size: 12 }, // smallest marker will be 12pt at 1:1128 scale { value: 288895, size: 12 }, { value: 73957191, size: 7 }, { value: 591657528, size: 1.5 } // smallest marker will be 1.5pt at 1:591657528 scale ] }, // maximum size to render maxDataVal at specified view scales maxSize: { type: "size", valueExpression: "$view.scale", stops: [ { value: 1128, size: 60 }, // largest marker will be 60pt at 1:1128 scale { value: 288895, size: 60 }, { value: 73957191, size: 37 }, { value: 591657528, size: 19 } // largest marker will be 19pt at 1:591657528 scale ] } }; renderer.visualVariables.push(sizeVisVar);
- SizeVisualVariable
The size visual variable defines the size of individual features in a layer based on a numeric (often thematic) value. This value comes from one of the following:
- An attribute
field - The value of an attribute
fielddivided by anormalizationField - A value returned from an Arcade expression specified in
valueExpression.
Size is defined in the form of a continuous ramp, which may be applied to renderers in either a MapView or a SceneView.
Symbol size may be applied either thematically, or literally using real-world units. See the following object specification tables for details about each potential use of a size visual variable:
- BoundedMinMax - Feature sizes are bounded by min and max data values.
- ThematicStops - Defines two or more stops at which feature sizes are mapped to data values.
- ScaleDependentIcons - Icons sizes are bounded by min and max data values, but the min and max sizes (and interpolated sizes) change based on the scale of the MapView.
- ScaleDependentStops - Defines the width of polygon outlines at various view scales.
- RealWorldSize - Feature sizes are determined based on real-world measurements and units, not thematic values and screen units.
- An attribute
- ThematicStops
Defines two or more stops at which feature sizes are mapped to data values in a size visual variable. Setting two stops will have the same effect as creating a BoundedMinMax size visual variable. Adding additional stops allows you to map specific sizes with data values. Sizes are interpolated linearly between stop values.
The object specification for this object is provided below.
- Properties:
- type String
Value must be
size.optionalfield StringThe name of the numeric attribute field that contains the data values used to determine the size of each feature.
optionalnormalizationField StringThe name of the numeric attribute field used to normalize the data in
field. If this field is used, then the values instopsshould be normalized as percentages or ratios.optionalvalueExpression StringAn Arcade expression evaluating to a number. This expression can reference field values using the
$featureglobal variable and perform mathematical calculations and logical evaluations at runtime. The values returned from this expression are the data used to drive the visualization. This takes precedence overfield. Therefore, this property is typically used as an alternative tofieldin visual variables.optionalvalueExpressionTitle StringThe title identifying and describing the associated Arcade expression as defined in the
valueExpressionproperty. This is displayed as the title of the corresponding size ramp in the Legend in the absence of a providedtitlein thelegendOptionsproperty.stops Object[]An array of objects that defines the thematic size ramp in a sequence of data or expression stops. At least two stops are required. The stops must be listed in ascending order based on the value of the
valueproperty in each stop. Each stop object has the following specification:optionallegendOptions ObjectAn object providing options for displaying the size ramp in the Legend.
optionalaxis StringDefault Value:allOnly applicable when working in a SceneView. Defines the axis the size visual variable should be applied to when rendering features with an ObjectSymbol3DLayer. See the local scene sample for an example of this.
Possible Value Description width The diameter of the symbol from east to west. depth The diameter of the symbol from north to south. height The height of the symbol. width-and-depth Applies the size visual variable to both width and depth axes. all Applies the size visual variable to all axes. optionaluseSymbolValue BooleanWhen setting a size visual variable on a renderer using an ObjectSymbol3DLayer, this property indicates whether to apply the value defined by the height, width, or depth properties to the corresponding axis of this visual variable instead of proportionally scaling this axis' value after other axes. View an example of this.
- See also:
Examples:// thematic size defined with stops var sizeVisVar = { type: "size", field: "POPULATION", stops: [{ value: 5000, size: "6px" }, { value: 1000000, size: "80px" }] }; renderer.visualVariables.push(sizeVisVar);// size visual variable with arcade var sizeVisVar = { type: "size", valueExpression: "( $feature.TOT_VOTES / $feature.REG_VOTERS ) * 100", stops: [{ value: 30, size: "6px" }, { value: 70, size: "60px" }] }; renderer.visualVariables.push(sizeVisVar);