 Hide Table of Contents
 Tutorials
 About the API
 Work with the API
 Graphics and feature layers
 Popups and Info Windows
 Geoprocessor
 Operations Dashboard
 Create extensions
 Mobile
 ArcGIS Server Services
 References
 What's New archive
An easy way to add interactivity to your ArcGIS JavaScript applications is through info windows that display information in response to a user action. From working with other APIs, you might know info windows as "balloons", "map tips", "callouts" or "popups". The concept is the same: the user clicks or hovers over a location on the map and sees information about that particular location.
How does an info window work?
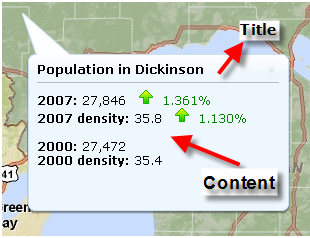
The Map has an info window that can be shown or hidden in response to events. Every info window has a title and content. The title is bold text that appears at the top of the info window. The content is the HTML that appears below. When you work with info windows, you will frequently call methods to set the title and content.

The default behavior when a graphic or feature layer is clicked is to show an info window. However, in order for this to happen you need to define an InfoTemplate for the graphic. The InfoTemplate defines the title and content that will display in the info window.
While the info window is typically used with a graphics layer or feature layer, you can also display the info window in response to a query or some other action that does not involve a graphic. For example, you can show an info window with the lat/lon coordinates when a user clicks on the map.
map.on("click", function(evt) {
  map.infoWindow.setTitle("Coordinates");
  map.infoWindow.setContent("lat/lon : " + evt.mapPoint.y + ", " + evt.mapPoint.x);
  map.infoWindow.show(evt.screenPoint,map.getInfoWindowAnchor(evt.screenPoint));
});
What can you do with info windows?
You can put almost anything in an info window because it supports HTML. Images, hyperlinks, tables, dynamically rendered charts etc. You can take advantage of Dojo to enhance your info windows. This picture shows information organized in a Dojo TabContainer in the info window.
Here's an example that displays a chart dynamically constructed for an info window using the Dojo charting library.
Just because you can put something in an info window does not always mean that you should. The BorderContainer and other elements in the Dojo layout libraries can help you organize information in sidebars, footers and accordion containers on your page. See the Working with Layouts help topic for an introduction to Dojo layouts. In some scenarios, these might be a more effective way to display information than an info window.
The application pictured below avoids info windows in favor of a right-hand content pane containing charts and other information. This application is available for download on the ArcGIS.com Code Gallery.