 Hide Table of Contents
 Tutorials
 About the API
 Work with the API
 Graphics and feature layers
 Popups and Info Windows
 Geoprocessor
 Operations Dashboard
 Create extensions
 Mobile
 ArcGIS Server Services
 References
 What's New archive
Legacy: This topic discusses extending operation views created using the Windows version Operations Dashboard for ArcGIS. This version of the application has been moved to Mature Support status. To learn more about the latest web-based version, see Operations Dashboard for ArcGIS.
Operations Dashboard for ArcGIS monitors real-time data and shows different views of data. As a developer, you can use the ArcGIS API for JavaScript to customize operation views for Operations Dashboard.
Extension types
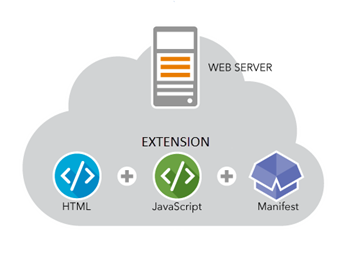
Using the ArcGIS API for JavaScript, you can develop extensions for operation views that can be used in both the Windows and browser versions of Operations Dashboard. You can extend operation views through the creation of widgets, map tools, and feature actions. To create extensions, you need to know HTML and JavaScript. The extensions run from a web server that requires a domain to host them. You will need to host a minimum of three files: a JSON based manifest file, an HTML container, and a JavaScript file.

Here are more details about the types of extensions:
- Widgets display information from various data sources, either static or dynamic.
- Map tools provide new functionality to the toolbar of a specific map widget.
- Feature actions offer options for interacting with features in a widget.
Widgets, map tools, and feature actions can be configured by the author of the operation view. To provide a certain workflow in an operation view, feature actions, widgets, and map tools can work together or independently of each other. Extensions use the ArcGIS API for JavaScript, including methods and classes for extending operation views.
Share extensions
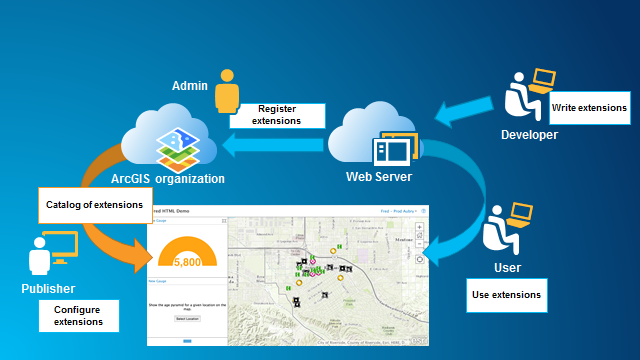
You can share your extensions with groups within your organization after the extensions have been hosted on your web server, taking the following into consideration:
- Extensions are registered and shared within an ArcGIS organization through an item by the administrator.
- The author can include and configure the extension in an operation view.
- The operation view can be shared to a group of users in the organization.

When you open an operation view, the extension authored in the operation view loads automatically in the Windows or browser app. The extension runs as a web app from the web server.
System and software requirements
- Operations Dashboard for ArcGIS 10.3.1 or later (Windows app). Download the latest version of Operations Dashboard.
- An ArcGIS organizational account.
- JavaScript API version 3.14 or later.
- A web server to host the extension.
- Note: JavaScript extensions are supported in Portal for ArcGIS 10.4 and later. To extend operation views with Portal for ArcGIS 10.3.x, use ArcGIS Runtime SDK for WPF.