 Hide Table of Contents
 Tutorials
About the API
Work with the API
Graphics and feature layers
Popups and Info Windows
Geoprocessor
Operations Dashboard
Create extensions
Mobile
ArcGIS Server Services
References
What's New archive
Tutorials
About the API
Work with the API
Graphics and feature layers
Popups and Info Windows
Geoprocessor
Operations Dashboard
Create extensions
Mobile
ArcGIS Server Services
References
What's New archive
Legacy: This topic discusses extending operation views created using the Windows version Operations Dashboard for ArcGIS. This version of the application has been moved to Mature Support status. To learn more about the latest web-based version, see Operations Dashboard for ArcGIS.
Debug an extension in Windows Operations Dashboard
Windows Operations Dashboard comes with a chromium debugger. Follow the tutorial to learn how to debug your extensions.
- Start Operations Dashboard from the debug shortcut you created. If you haven't already created this shortcut, see set up a development environment.
- Open the operation view with the extension that you want to debug.
-
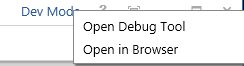
On the top right corner of the title bar, click Dev Mode, and choose Open Debug
Tool.
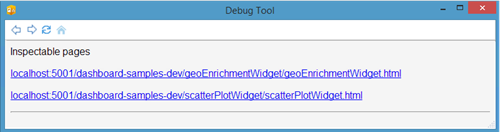
The debugger tool will display a list of URL(s) for all the extensions used in the operation view.
Note: You can also click on the triangle icon located at the top of your extension's HTML page to open the debug window. Alternatively, click on the widget that you want to debug, and use the Ctrl + Shift + I shortcut keys to open the debug window.

- Click the URL of the extension you want to debug.
- A debugging tool window will open, where you can inspect the HTML elements of the extension.
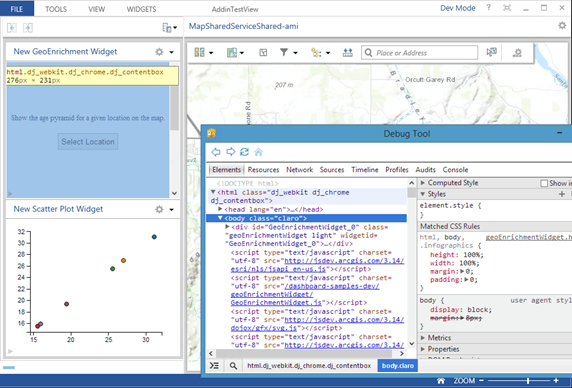
Using the tools inside of the debugger, you can perform a number of debugging activities, such as inspecting UI elements, checking network traffic, loading the extension's source code, and placing break points for further investigation.
Note: If you have questions about the chromium debugger, please contact Esri Support.
Debug an extension in browser Operations Dashboard
You can debug your extension in browser Operations Dashboard just like you would debug any other web application.
Note: IE9 is not supported for debugging using localhost due to its lack of CORS support. Read Set up a web server for more information.
- Start Windows Operations Dashboard from the debug shortcut if you have already done so.
- Open the operation view that includes the extension that you want to debug.
- On the top right corner of the title bar, click Dev Mode, and choose Open in
Browser.
The operation view will load in your default browser where you can use your browser's debug tool to start debugging your extension.