Hide Table of Contents
 Tutorials
About the API
Work with the API
Graphics and feature layers
Popups and Info Windows
Geoprocessor
Operations Dashboard
Create extensions
Mobile
ArcGIS Server Services
References
What's New archive
Tutorials
About the API
Work with the API
Graphics and feature layers
Popups and Info Windows
Geoprocessor
Operations Dashboard
Create extensions
Mobile
ArcGIS Server Services
References
What's New archive
Samples
Legacy: This topic discusses extending operation views created using the Windows version Operations Dashboard for ArcGIS. This version of the application has been moved to Mature Support status. To learn more about the latest web-based version, see Operations Dashboard for ArcGIS.
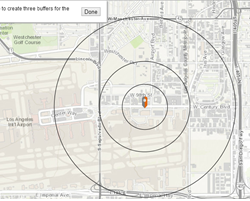
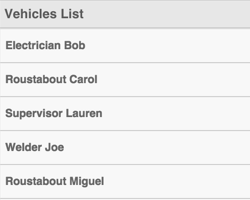
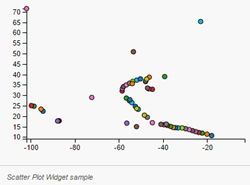
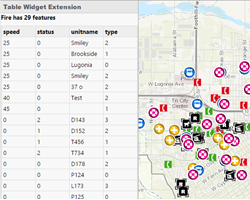
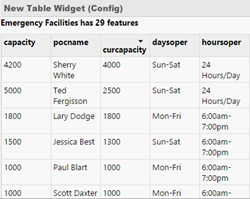
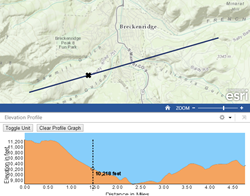
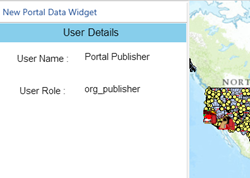
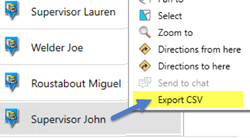
These samples demonstrate how to extend operation views for Operations Dashboard using the ArcGIS API for JavaScript. You can find the latest sample code here.
|
|
||||
|
|
||||
|
|
||||
|
|
||||
|
|
||||
|
|