HeatmapRenderer
require(["esri/renderers/HeatmapRenderer"], function(HeatmapRenderer) { /* code goes here */ });esri/renderers/HeatmapRendererThe HeatmapRenderer renders point FeatureLayers and CSVLayers as a raster surface, emphasizing areas with a high density of points. This renderer uses a Gaussian Blur to determine the strength of the influence of each point over an area determined by the blurRadius. A Gaussian, or normal, distribution is used to spread the color of the point so it appears to be a fuzzy circle.
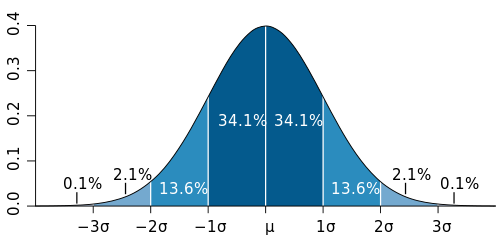 |  |
The process described in the caption above is repeated for each point. Each time the calculation is performed, each pixel's intensity value will accumulate based on its proximity to multiple points. Pixels are then colored along a continuous color ramp based on the overall intensity value assigned to each pixel. This will produce a continuous surface showing where a high density of points occur versus areas with little or no data.
If a field is specified in the renderer, the intensity values of each pixel are multiplied by the value of the specified attribute field. This gives pixels higher or lower weights depending on the values of the specified attribute at nearby point locations.
Colors are assigned to each pixel based on their intensity value. The color ramp specified by the colorStops property maps specific colors to the ratio of the pixel's intensity value to the maxPixelIntensity. This eases the process for creating your own color stops since you don't need to know the range of intensity values in your view.
Read more
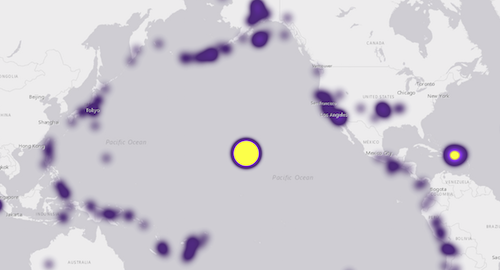
The default values of the HeatmapRenderer are a good start, but they may not work well for your dataset and the message you're trying to convey. For example, the image below depicts a heatmap of earthquakes where the developer set their own colorStops, but accepted the default blurRadius, maxPixelIntensity, and minPixelIntensity.
Blur radius (area of influence)
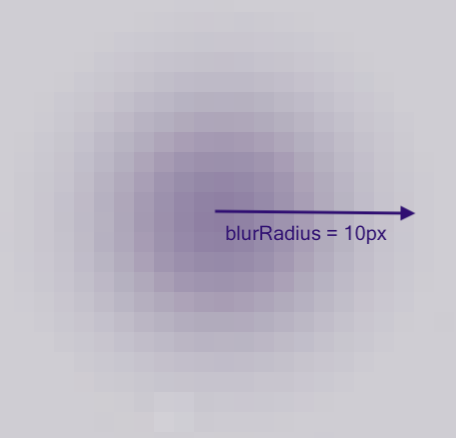
The blurRadius indicates the area of influence of each point in pixels. By default, this value is 10. If you zoom to a single point very closely, you can verify the blurRadius from the center of the point.
As you increase the value of the blurRadius, the overall heatmap will become larger, and appear hotter since the area of influence of each point increases. The image below shows what the same heatmap looks like if you double the blurRadius to 20px.
If you decrease the blurRadius, the heatmap will appear colder and less dense. The image below shows what the same heatmap looks like with a blurRadius of 5px.
Working with intensity values
By default, the maxPixelIntensity of the renderer is 100, and the minPixelIntensity is 0. In most cases, the minPixelIntensity will not need to be altered since 0 works in most visualizations. However, it is highly likely that the maxPixelIntensity will need to be tweaked.
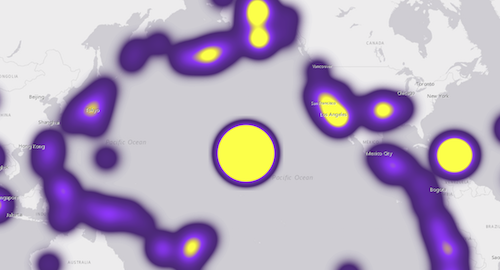
The maxPixelIntensity sets an upper bound on which pixels will be shaded with the highest (or hottest) color defined in the colorStops. The lower the maxPixelIntensity, the hotter the map will look since the standard for "heat" in the map is lower and more inclusive.
Using the same example from above, if you lower the maxPixelIntensity, to something like 10, you'll see the following visual.
![]()
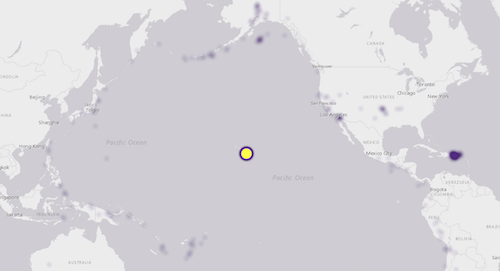
On the other hand, if you increase the maxPixelIntensity to a high number like 250, the heatmap will look much colder.
![]()
Increasing the minPixelIntensity essentially filters out areas with fewer points. Keep in mind that this isn't a true filter. The data is still present in the view, so you can click it and view the popup for points even if they don't appear to be there. This is a good technique for removing excess noise in some heatmaps.
The image below shows the same heatmap with a minPixelIntensity of 10.
![]()
The colors defined in the colorStops are mapped to the ratio of the intensity value of each pixel to the maxPixelIntensity of the renderer. So if a pixel has an intensity value of 300, and the maxPixelIntensity is 250, the pixel will be colored with the hottest color if the ratio for that color defined in the stops is 1. If the pixel has an intensity value of 50, it will have a ratio of 0.2 and will be assigned to the color corresponding to that value.
Therefore, altering the ratios of the stops can have a similar effect as modifying the maxPixelIntensity and minPixelIntensity in making a heatmap look hotter or colder.
Known Limitations
HeatmapRenderer is not currently supported in 3D SceneViews
layer.renderer = {
  type: "heatmap",
  field: "crime_count",
  colorStops: [
    { ratio: 0, color: "rgba(255, 255, 255, 0)" },
    { ratio: 0.2, color: "rgba(255, 255, 255, 1)" },
    { ratio: 0.5, color: "rgba(255, 140, 0, 1)" },
    { ratio: 0.8, color: "rgba(255, 140, 0, 1)" },
    { ratio: 1, color: "rgba(255, 0, 0, 1)" }
  ],
  minPixelIntensity: 0,
  maxPixelIntensity: 5000
};
Constructors
- new HeatmapRenderer(properties)
- Parameter:properties Objectoptional
See the properties for a list of all the properties that may be passed into the constructor.
Property Overview
| Name | Type | Summary | Class | |
|---|---|---|---|---|
| AuthoringInfo | Authoring metadata only included in renderers generated from one of the Smart Mapping creator methods, such as sizeRendererCreator.createContinuousRenderer() or colorRendererCreator.createContinuousRenderer(). more details | more details | Renderer | |
| Number | The area of influence for each point in the layer. more details | more details | HeatmapRenderer | |
| HeatmapColorStop[] | An array of objects describing the renderer's color ramp. more details | more details | HeatmapRenderer | |
| String | The name of the class. more details | more details | Accessor | |
| String | The name of the attribute field used to weight the intensity of each heatmap point. more details | more details | HeatmapRenderer | |
| Number | The pixel intensity value that determines which pixels are assigned the final color in the colorStops. more details | more details | HeatmapRenderer | |
| Number | The pixel intensity value used to determine which pixels will be assigned the initial color in the colorStops. more details | more details | HeatmapRenderer | |
| String | The type of renderer. more details | more details | HeatmapRenderer |
Property Details
- blurRadiusNumber
The area of influence for each point in the layer. This is defined as a radius in pixels. The default is
10, which means the pixels within a 10-pixel radius of the point's location are assigned an intensity value corresponding to their distance from the nearby point. Increasing this value creates a larger heatmap with more hotspots. Decreasing it makes a smaller heatmap with fewer hotspots.- Default Value:10
- colorStopsHeatmapColorStop[]
An array of objects describing the renderer's color ramp. The ratio of a pixel's intensity value to the maxPixelIntensity of the renderer is mapped to a corresponding color along a continuous ramp. The color of the first stop (i.e. the stop with the lowest
ratiovalue) must have an alpha value of0for the underlying basemap to be visible in the app.The default value is the following:
[
  { ratio: 0, color: "rgba(255, 140, 0, 0)" },
  { ratio: 0.75, color: "rgba(255, 140, 0, 1)" },
  { ratio: 0.9, color: "rgba(255, 0,   0, 1)" }
]
- Since: ArcGIS API for JavaScript 4.7
The name of the class. The declared class name is formatted as
esri.folder.className.
- fieldString
The name of the attribute field used to weight the intensity of each heatmap point.
For example, suppose you have a layer of points representing buildings containing a field
num_unitsfor the number of units in the building (if it's an apartment complex). You could weight the heatmap renderer based on thenum_unitsfield to create a heatmap representing the density of housing units in a city.Example:renderer.field = "num_units";
- maxPixelIntensityNumber
The pixel intensity value that determines which pixels are assigned the final color in the colorStops. Pixelx with intensity values above this number will be assigned the final (or hottest) color in the color ramp.
Typically,
minPixelIntensitywill be zero andmaxPixelIntensitywill be set to a high value appropriate for the dataset. The default may not be ideal for your dataset, so this value will likely need to change.Determining the best values for
minPixelIntensityandmaxPixelIntensityis an exercise left up to the developer since different types, scales, densities, and distributions of data will require different values for these properties to create a visually pleasing separation of high and low intensity areas appropriate for the data and the application.- Default Value:100
Example:renderer.maxPixelIntensity = 5000;
- minPixelIntensityNumber
The pixel intensity value used to determine which pixels will be assigned the initial color in the colorStops. Pixels with intensity values below this number will be excluded from the visualization.
When using a field to weight the points, setting
minPixelIntensityabove zero might help to visually deemphasize frequently occurring but low value point clusters. This property does not actually filter the data or modify the calculated intensity value. Rather, it scales the color ramp such that a higher intensity value is required for a pixel to get a noticeable color.Determining the best values for
minPixelIntensityandmaxPixelIntensityis an exercise left up to the developer since different types, scales, densities, and distributions of data will require different values for these properties to create a visually pleasing separation of high and low intensity areas appropriate for the data and the application.- Default Value:0
Example:renderer.minPixelIntensity = 50;
- typeStringreadonly
The type of renderer. For HeatmapRenderer this value is always
heatmap.
Method Overview
| Name | Return Type | Summary | Class | |
|---|---|---|---|---|
| HeatmapRenderer | Creates a deep clone of the renderer. more details | more details | HeatmapRenderer | |
| * | Creates a new instance of this class and initializes it with values from a JSON object generated from a product in the ArcGIS platform. more details | more details | Renderer | |
| Object | Converts an instance of this class to its ArcGIS portal JSON representation. more details | more details | Renderer |
Method Details
- clone(){HeatmapRenderer}
Creates a deep clone of the renderer.
Returns:Type Description HeatmapRenderer A deep clone of the object that invoked this method. Example:// Creates a deep clone of the first layer's renderer var renderer = view.map.layers.getItemAt(0).renderer.clone();
- fromJSON(json){*}static
Creates a new instance of this class and initializes it with values from a JSON object generated from a product in the ArcGIS platform. The object passed into the input
jsonparameter often comes from a response to a query operation in the REST API or a toJSON() method from another ArcGIS product. See the Using fromJSON() topic in the Guide for details and examples of when and how to use this function.Parameter:json ObjectA JSON representation of the instance in the ArcGIS format. See the ArcGIS REST API documentation for examples of the structure of various input JSON objects.
Returns:Type Description * Returns a new instance of this class.
Converts an instance of this class to its ArcGIS portal JSON representation. See the Using fromJSON() topic in the Guide for more information.
Returns:Type Description Object The ArcGIS portal JSON representation of an instance of this class.