predominance
require(["esri/renderers/smartMapping/creators/predominance"], function(predominanceRendererCreator) { /* code goes here */ });esri/renderers/smartMapping/creators/predominanceThis object contains a helper method for generating a predominance visualization. Visualizing predominance involves coloring a layer’s features based on which attribute among a set of competing numeric attributes wins or beats the others in total count. Common applications of this include visualizing election results, survey results, and demographic majorities.
For example, suppose you have a layer of U.S. counties with fields containing the total sales of various crops: wheat, soybeans, corn, cotton, and vegetables. You can use the createRenderer() method in this module to generate a default visualization depicting the winner, or most predominant crop, in each county.
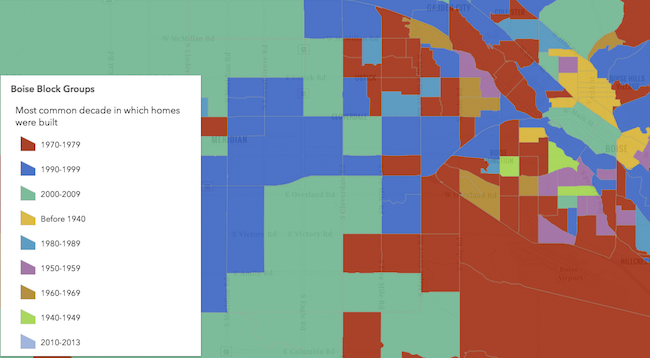
The example below depicts the predominant decade in which homes were constructed based on a city's block groups.
Known Limitations
- Currently, 3D symbols cannot be generated for layers with a
polylineorpolygongeometry type. - Only FeatureLayer, SceneLayer, CSVLayer, and PointCloudLayer layer types are currently supported, except in the following scenarios:
- SceneLayers without the
supportsRendererandsupportsLayerQuerycapabilities enabled, unless a predefined statistics object is passed to thestatisticsparameter of the method in conjunction with the layer. To check a SceneLayer's capabilities, use the getFieldInfoUsage() method.
- SceneLayers without the
Method Overview
| Name | Return Type | Summary | Object | |
|---|---|---|---|---|
| Promise<RendererResult> | Generates a predominance renderer based on a set of competing numeric fields. more details | more details | predominance |
Method Details
- createRenderer(params){Promise<RendererResult>}
Generates a predominance renderer based on a set of competing numeric fields.
Visualizing predominance involves coloring a layer’s features based on which attribute among a set of competing numeric attributes wins or beats the others in total count. Common applications of this include visualizing election results, survey results, and demographic majorities.
For example, suppose you have a layer of U.S. counties with fields containing the total sales of various crops: wheat, soybeans, corn, cotton, and vegetables. If a feature has the following values for each field:
Field Name Count Color Wheat 130 purple Soybeans 2000 blue Corn 0 yellow Cotton 300 green Vegetables 120 red Then the renderer symbolizes the feature with a blue color since Soybeans is the predominant crop.
The predominant field of a feature is determined based on the result of an Arcade expression generated by this method. You are required to provide a
layer,view, and list offieldsto generate this renderer. Optionally, you can setincludeSizeVariabletotrueto change the size of each feature to indicate how influential the feature is compared to the entire layer as a whole. You can also setincludeOpacityVariabletotrueto add opacity to each feature depending on how strong the predominant field is compared to all the other fields. For the example above, the feature would likely be opaque since Soybeans beats all other features combined by a wide margin. If the Soybean total were still the highest, but only 301, then the feature would be very transparent, indicating the Soybean total wins, but not by a wide margin.Other options are provided for convenience for more involved custom visualization authoring applications.
Parameters:params ObjectInput parameters for generating a predominance visualization based on a set of competing field(s). See the table below for details of each parameter.
Specification:layer FeatureLayer|SceneLayer|CSVLayerThe layer for which the visualization is generated.
view ViewThe view instance in which the visualization will be rendered.
fields Object[]A set of competing numeric fields used as the basis of the predominance visualization. For example, if creating an election map, you would indicate the names of each field representing the candidate or political party where total votes are stored.
Specification:name StringThe name of a numeric field.
label StringoptionalThe label describing the field name (or category) in the legend. This is should be used if the given field doesn't have an intuitive field name. For example, for a field named
demrepresenting the total vote count for the Democratic party, you can set the label toDemocratto clarify the name of the category in the final visualization.optional Default Value: grayThe named string or basemap object of the Esri basemap that will be paired with the output visualization.
includeOpacityVariable BooleanoptionalIndicates whether to include data-driven opacity in the final renderer. If
true, features where the predominant value beats all others by a large margin are given a high opacity. Features where the predominant value beats others by a small margin will be assigned a low opacity, indicating that while the feature has a winning value, it doesn't win by much.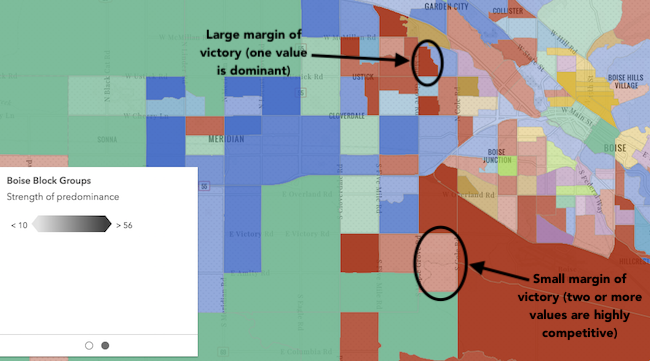 includeSizeVariable Booleanoptional
Indicates whether to include data-driven size in the final renderer. If
true, features will be assigned a sized based on the sum of all competing values in thefieldsparam. Features with small total counts will be sized with small icons or lines depending on the geometry type of the layer, and features with large total counts will be sized with large icons or lines. Enabling this option is good for visualizing how influential a particular feature is compared to the dataset as a whole. It removes bias introduced by features with large geographic areas, but relatively small data values.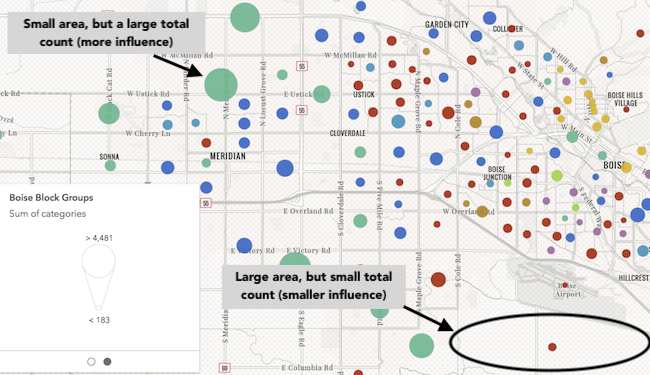 legendOptions Objectoptional
Provides options for modifying Legend properties describing the visualization.
Specification:title StringoptionalThe title used to describe the renderer in the Legend.
showLegend BooleanoptionalIndicates whether to include the renderer in the legend.
statistics SummaryStatisticsResultoptionalA statistics object generated from the summaryStatistics function. The
createAgeRenderer()method generates an Arcade expression and executes a statistics query against the layer for the result of the expression. If statistics for the expression have already been generated, then pass the object here to avoid making a second statistics query.sortBy StringoptionalDefault Value: countIndicates how values should be sorted in the Legend. See the table below for information about values that may be passed to this parameter.
Possible Value Description count Unique values/types will be sorted from highest to lowest based on the count of features that fall in each category. value Unique values/types will be sorted in the order they were specified in the fieldsparameter.Possible Values: count | value
predominanceScheme PredominanceSchemeoptionalIn authoring apps, the user may select a pre-defined predominance scheme. Pass the scheme object to this property to avoid getting one based on the
basemap.symbolType StringoptionalDefault Value: 2dThe type of symbol to generate. This depends on the view in which you are working and the desired visualization. This parameter does not need to be specified for layers with a
meshgeometry type. Possible values are described below.Value Description 2d Generates a visualization using 2D symbols such as SimpleMarkerSymbol, SimpleLineSymbol, or SimpleFillSymbol. Use this option if generating a visualization for data in a MapView. 3d-flat Generates a visualization using 3D symbols with flat symbol layers such as IconSymbol3DLayer, LineSymbol3DLayer, or FillSymbol3DLayer. Use this option if generating a 2D visualization for data in a SceneView. 3d-volumetric Generates a visualization using 3D symbols with volumetric symbol layers such as ObjectSymbol3DLayer, PathSymbol3DLayer, or ExtrudeSymbol3DLayer. Use this option if generating a 3D visualization for data in a SceneView. A SceneView instance must be provided to the viewparameter if this option is used.defaultSymbolEnabled BooleanoptionalDefault Value: trueEnables the
defaultSymbolon the renderer and assigns it to features with no value.colorMixMode StringoptionalDefault Value: replaceThis option only applies to generating renderers for mesh SceneLayers. Specifies how the symbol's color is applied to the geometry color/texture. See the documentation in FillSymbol3DLayer.material for more context. See the table below for possible values.
Value Description tint Applies the symbol colorto the desaturated geometry/texture color.replace Removes the geometry/texture color and applies the symbol color.multiply Multiplies geometry/texture color value with the symbol colorvalue. The result is a darker color. Multiplying with white keeps the geometry color the same.Returns:Type Description Promise<RendererResult> Resolves to an instance of RendererResult. Example:const layer = new FeatureLayer({ url: "https://services.arcgis.com/V6ZHFr6zdgNZuVG0/ArcGIS/rest/services/USA_County_Crops_2007/FeatureServer/0" }); // will create a visualization of predominant crop by U.S. county const params = { layer: layer, view: view, basemap: map.basemap, // "gray" fields: [{ name: "M217_07", label: "Vegetables" }, { name: "M188_07", label: "Cotton" }, { name: "M172_07", label: "Wheat" }, { name: "M193_07", label: "Soybeans" }, { name: "M163_07", label: "Corn" }], includeOpacityInfo: true }; // when the promise resolves, apply the renderer to the layer predominanceRendererCreator.createRenderer(params) .then(function(response){ layer.renderer = response.renderer; });
Type Definitions
- RendererResult
The result object of the createRenderer() method. See the table below for details of each property.
- Properties:
- renderer UniqueValueRenderer
The unique value renderer object representing the predominance visualization. Set this on a layer's
rendererproperty to update its visualization.predominantCategoryInfos UniqueValueInfo[]An array of objects describing the value, symbol, and count of each unique type or category represented in the renderer.
excludedCategoryInfos Object[]An array of objects describing the values or categories excluded from consideration in visualizing data from the given fields. The specification of each object matches that of the objects specified in the
predominantCategoryInfosproperty.optionalsize VisualVariableResultA size visual variable representing the total count of all fields included in the predominance visualization. This is included if the
includeSizeVariableparameter is true.optionalopacity VisualVariableResultAn opacity visual variable representing the percentage of the total count comprised by the predominant value of all fields. This variable indicates the strength of a particular value's predominance compared to the other values.
predominanceScheme PredominanceSchemeThe predominance scheme used by the renderer based on the given basemap.
basemapId StringThe ID of the basemap used to determine the optimal fill color of the features.